
Home --> Background --> Health Disparities in Delaware
|
|
Health Disparities in Delaware |
|
|
IN THIS SECTION:
- Social Determinants of Health in Delaware - Inequities in Health Status in Delaware - Health Care Spending in Delaware |
Trends in Delaware generally reflect those of the U.S. and illustrate the interconnectedness of the ethical, practical, and economic perspectives.
This section highlights examples of social inequities in health central to the ethical case for change, summarizes the economic case for change in relation to healthcare spending in the state, and makes the practical case for change directly relevant to local stakeholders in Delaware. |
The health profile of the United States is poor relative to the rest of the world. The health profile of Delaware generally follows similar trends and patterns to those of the nation. For instance, the average life expectancy in 2010 in Delaware is 78.4 years (compared with 78.9 years nationally). Delaware’s infant mortality rate of 8.7 per 1,000 live births in 2011 was high relative to the national average of 6.1 per 1,000 live births
Social Determinants of Health in Delaware
According to the State of Delaware Community Health Status Assessment (CHSA) published in 2013, “Quality of life and health status are intrinsically linked to economic, income and educational attainment of Delaware residents.” (DHSS, 2013) Recent economic trends have contributed to poor social conditions among certain communities in the state and the resulting inequities in income, education, and other social factors are apparent in Delaware’s population. For instance, according to the CHSA:
- Poverty levels increased by 20 percent between 2006 and 2012, contributing to a growing divide between the wealthy and the poor.
- In 2010, the percentage of children living in families at or below the poverty level was 18 percent. This was the highest child poverty rate in 10 years.
- The homeless population, the majority of whom are African American, has dramatically increased in Delaware.
- High school graduation rates have steadily increased, but Whites still have higher graduation rates than African Americans and Hispanics.
geographical DISTRIBUTION of Income and education across delaware
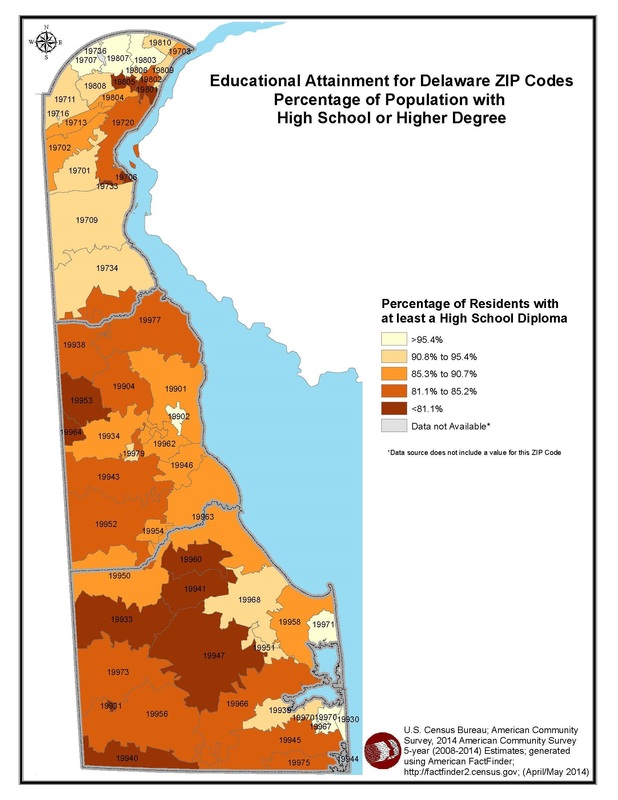
The maps in Figures 1 and 2 (shown below), produced by the Delaware Division of Public Health (DPH) and the State Office of Planning Coordination (OSPC), illustrate how some of the resources needed for health are distributed. Figure 10 shows median income by ZIP code and indicates areas with large differences in income. In the northern part of Delaware, very high income communities border very low income communities. This is important given that emerging research suggests that income inequality is linked to poor health outcomes for everyone, not just those living in the poorer communities (Wilkinson & Pickett, 2006). Figure 2, which shows educational attainment by ZIP code, reveals similar patterns. Noticeably, many Delawareans who did not earn a high school diploma reside in low income communities. Although limitations in the statistical significance of Figures 1 and 2 prevent us from concluding definitively that there is a relation between these multiple risk factors, the concept of cumulative disadvantage is necessary to explore and understand. Explicitly, cumulative disadvantage is the increased likelihood of poor health outcomes with each additional risk factor. Each risk factor puts individuals increasingly in jeopardy of “falling into the river” of poor health outcomes.

|
Figure 1 shows median income by ZIP code and indicates areas with large differences in income. In the northern part of Delaware, very high income communities border very low income communities. This is important given that emerging research suggests that income inequality is linked to poor health outcomes for everyone, not just those living in the poorer communities (Wilkinson & Pickett, 2006).
|
Figure 2 shows educational attainment by ZIP code, reveals similar patterns. Noticeably, many Delawareans who did not earn a high school diploma reside in low income communities.
|
Inequities in Health Status in Delaware
Health inequities may be understood as differences in health that are socially-determined. They are related to differences in the quality and distribution of the determinants of health, such as income and education, and are often most prominent across categories of race or ethnicity. The CHSA report highlights inequities in health outcomes by race and ethnicity (DHSS, 2013):
- African American infants have a significantly higher infant mortality rate than Caucasian infants, by as much as 2.8 times greater during some years. This gap is seen in all three of Delaware’s counties.
- The homicide rate for African American men doubled between 1997 and 2009, and is four times higher than for Caucasian men.
- Sixty-six percent of the people living with HIV/AIDS in Delaware are African American, despite the fact that African Americans only account for 21 percent of the state’s population. Hispanics account for 6 percent of the HIV/AIDS population and only 5 percent of the state’s population.
The link between Socioeconomic Status and Health Status in delaware
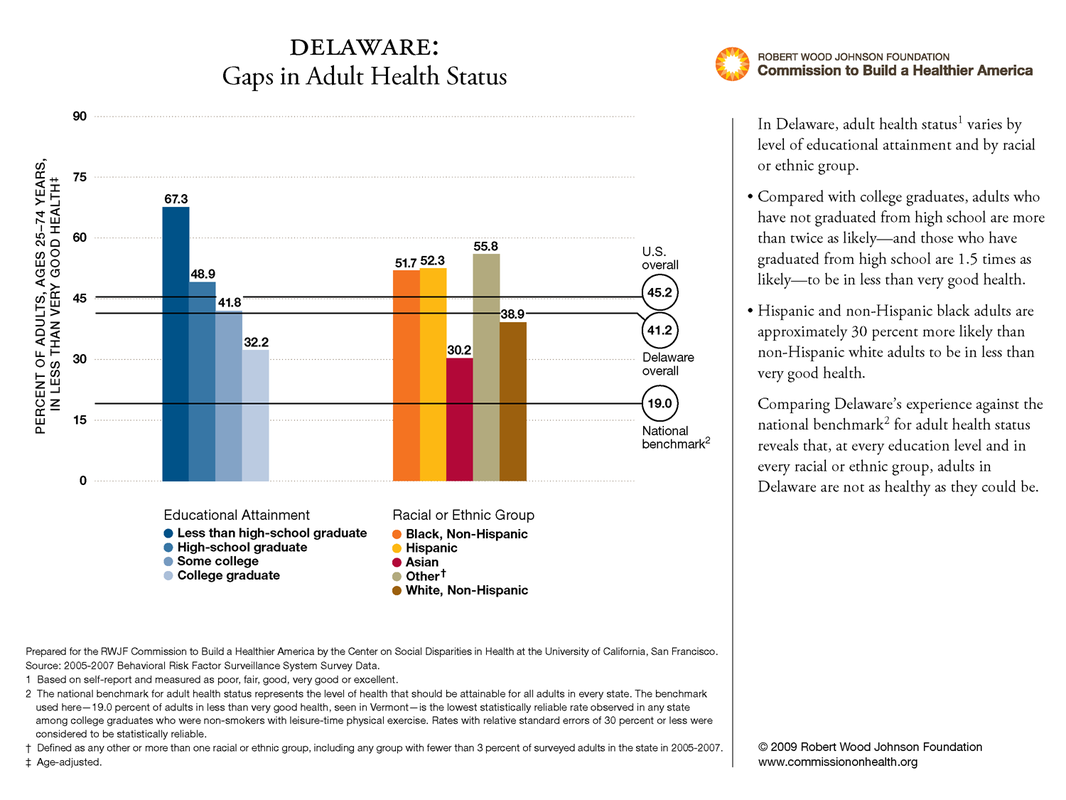
Race/ethnicity, income, and education are related in complex ways and can interact to produce differences in health. Importantly, however, each is thought to contribute independently to health and health inequities. One should not be considered a proxy for another. Figures 3-5 (shown below), reproduced courtesy of the Robert Wood Johnson Foundation Commission to Build a Healthier America, illustrate the patterns of health inequities in Delaware according to such social characteristics.
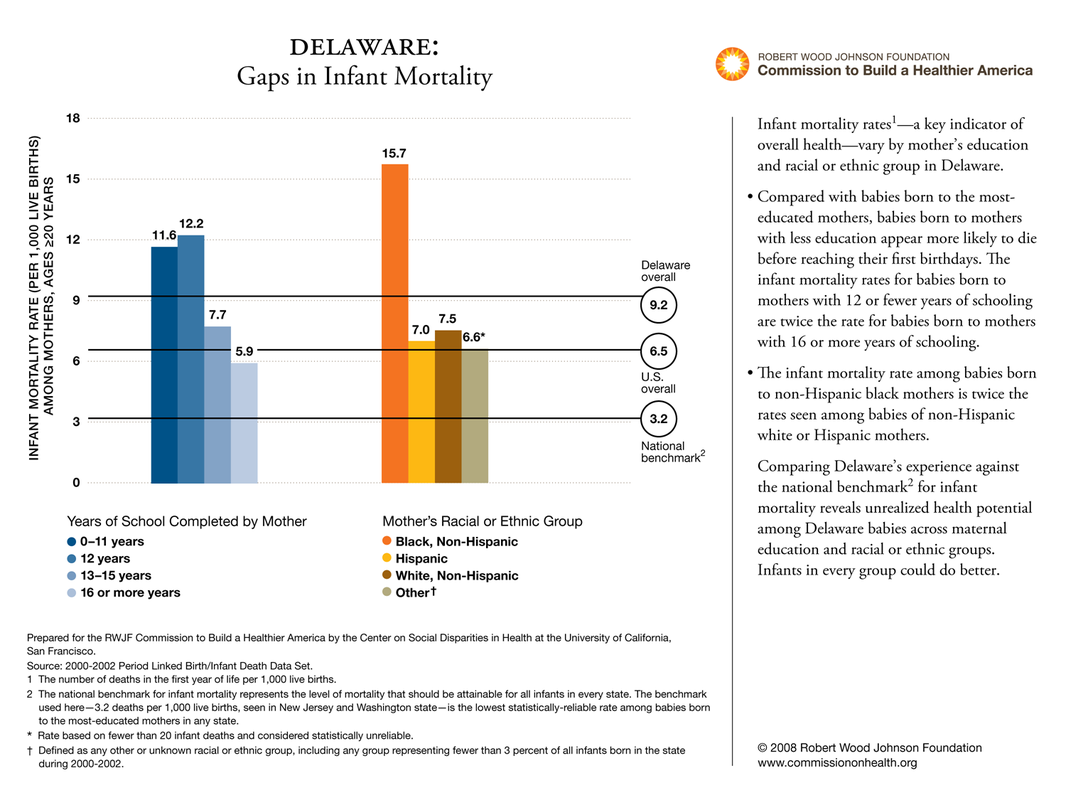
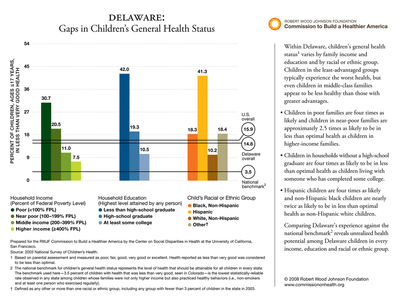
As seen in Figure 3, the average percentage of adults in less than very good health in Delaware is better than the national average, but is still far from the national benchmark. Furthermore, the Commission concludes “at every educational level and in every racial or ethnic group, adults in Delaware are not as healthy as they could be.” Similar trends can be seen with infant mortality (Figure 4) and children’s health status (Figure 5). With respect to the latter, the Commission concludes that there is “unrealized health potential among Delaware children in every income, education, and racial or ethnic group.”
As seen in Figure 3, the average percentage of adults in less than very good health in Delaware is better than the national average, but is still far from the national benchmark. Furthermore, the Commission concludes “at every educational level and in every racial or ethnic group, adults in Delaware are not as healthy as they could be.” Similar trends can be seen with infant mortality (Figure 4) and children’s health status (Figure 5). With respect to the latter, the Commission concludes that there is “unrealized health potential among Delaware children in every income, education, and racial or ethnic group.”
It is becoming increasingly evident that important differences in health indicators exist by geographic location, which is related to, but distinct from, other socioeconomic factors.
According to the CHSA (DHSS, 2013):
According to the CHSA (DHSS, 2013):
- HIV/AIDs rates are highest in New Castle County (with a rate of 44.4 percent in the City of Wilmington).
- Obesity has increased at faster rates in recent years in New Castle County than in Kent or Sussex County.
- Although cancer death rates are generally decreasing, Kent County has the highest rate and is decreasing at the slowest pace.
- Kent County sheltered 337 women and children victims of domestic violence in 2010, compared to 212 women and children victims in Sussex and New Castle County combined.
- In 2010, there were 18 days on which ozone levels surpassed the eight-hour safe limit; 14 days were in New Castle County, five were in Kent County, and nine were in Sussex County. (Note that of the 18 days, there were some days in which the ozone levels were high in more than one county, hence the overlap.)
The Geographical Landscape of health in delaware
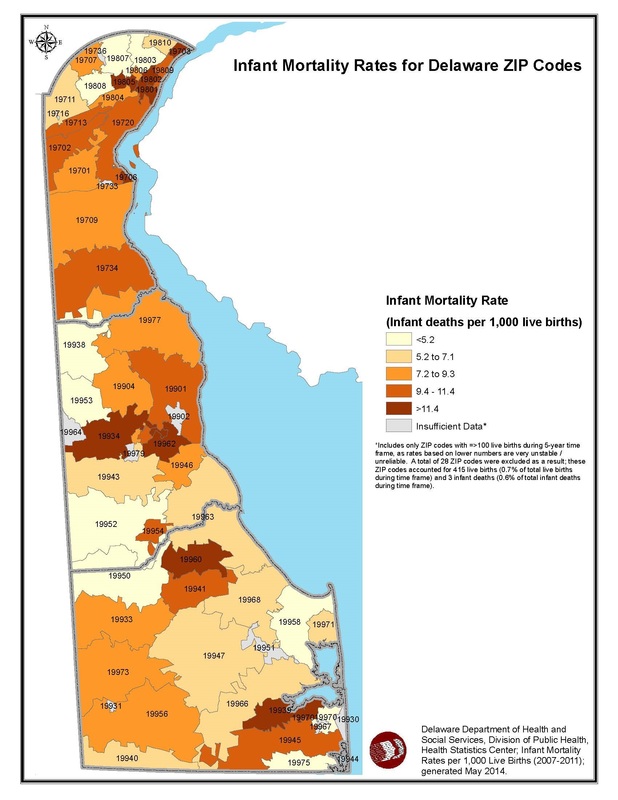
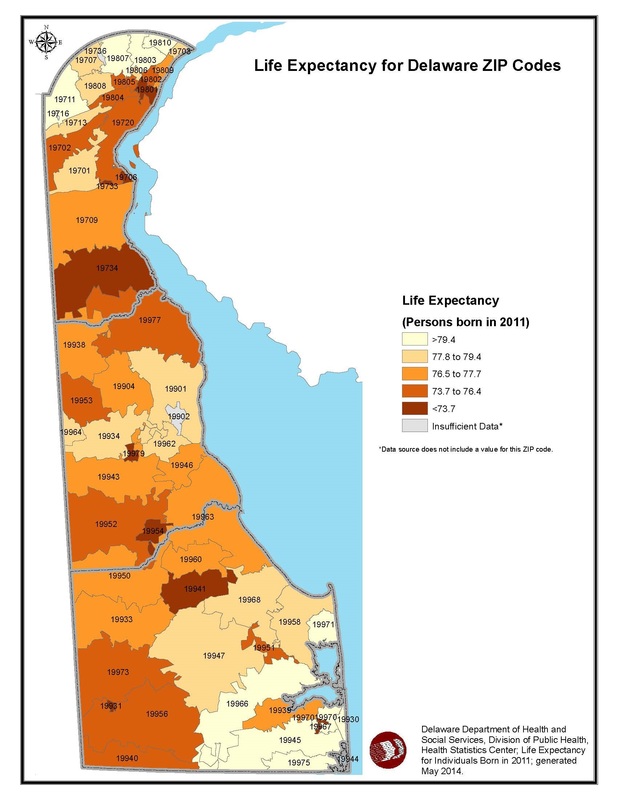
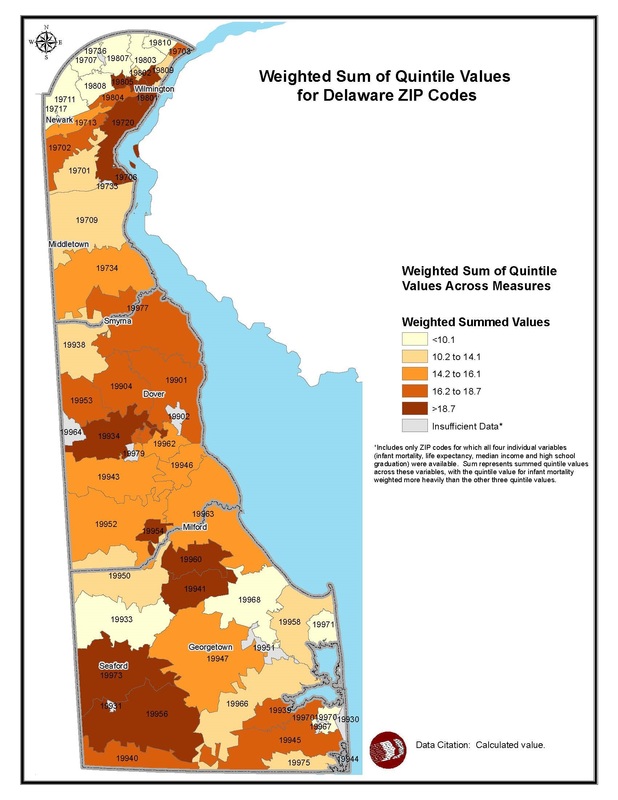
Figures 6, 7, and 8 (shown below) depict maps, produced by DPH and the Office of State Planning Coordination (OSPC), which illustrate geographic variations in infant mortality rates (Figure 6) and life expectancy (Figure 7). Figure 8 depicts how certain geographic areas have a preponderance of health-related risk factors and burdens compared with other parts of the state. This map was generated by calculating a cumulative measure of selected variables: infant mortality, life expectancy, median income, and high school graduation rates. It should not be interpreted as confirming direct causal linkages between social determinants of health (SDOH) and health outcomes; more analysis is needed to provide that level of understanding. Rather, it is meant to provide a visual representation of selected SDOH and related health indicators across the state, and to highlight areas of opportunity for improvement.
Importantly, these figures provide only snapshots of selected indicators of health status; they are not comprehensive nor do they reflect changes over time. Similarly, the data are aggregated at the ZIP code level, which may obscure differences that could emerge at smaller geographic levels (e.g. census tracts or block groups). Despite these limitations, and remembering the stream parable, one can clearly see on these maps that the communities with the darkest shades are those with the weakest bridges and fences, and individuals living near them are more at risk of falling into the stream of poor health outcomes.
Importantly, these figures provide only snapshots of selected indicators of health status; they are not comprehensive nor do they reflect changes over time. Similarly, the data are aggregated at the ZIP code level, which may obscure differences that could emerge at smaller geographic levels (e.g. census tracts or block groups). Despite these limitations, and remembering the stream parable, one can clearly see on these maps that the communities with the darkest shades are those with the weakest bridges and fences, and individuals living near them are more at risk of falling into the stream of poor health outcomes.
Limitations of this Data: These figures provide only snapshots of selected indicators of health status; they are not comprehensive nor do they reflect changes over time. Similarly, the data are aggregated at the ZIP code level, which may obscure differences that could emerge at smaller geographic levels (e.g. census tracts or block groups). Despite these limitations, and remembering the stream parable, one can clearly see on these maps that the communities with the darkest shades are those with the weakest bridges and fences, and individuals living near them are more at risk of falling into the stream of poor health outcomes.
Health Care Spending in Delaware
Health care expenditures in Delaware generally mirror national trends. In 2009, Delaware spent approximately $8,480 per capita (including both public and private spending) for health care services. This places Delaware as one of the top five states in per capita health care spending (CMS, 2013).
Approximately 500,000 residents, or 55 percent of Delawareans, are covered by private insurance. The average family premium per enrolled employee in employer-based health insurance was approximately $15,600 in 2012, slightly above the national average. This includes approximately $4,100 paid by the employee and approximately $11,500 paid by the employer.
Medicaid
|
Even prior to Medicaid expansion through the Affordable Care Act, Delaware’s expenditures for Medicaid—the publicly funded insurance program for low income families, children, pregnant women, and people with disabilities—have increased steadily since 1996 and exceeded 17 percent of the state’s 2013 budget (CMS, 2013).
Approximately one-quarter of the state’s population is enrolled in the Medicaid program and more than half of all births in the state were financed by Medicaid in 2009 (DPH, 2011). This is relevant to the economic case for change, considering that Medicaid is a resource available to low income persons and the amount of money spent due to income inequities exceeds what would be spent if those inequities were absent. Figure 9 (shown right) illustrates the percent of Delaware’s population covered by Medicaid. It is not surprising that the communities with the highest concentration of Medicaid enrollment mirror those communities with other social burdens and health needs. This further makes the case for investing in prevention in Delaware’s low income communities. |

Fig. 9
Medicaid coverage by census tract in Delaware Source: Center for Community Research & Services, 2014. |
Preventable Hospitalizations
The rate of preventable hospitalization is an indicator often used to assess the quality of health care services in a particular area. According to the Agency for Healthcare Research and Quality (AHRQ), hospitalizations may be avoided if clinicians effectively diagnose, treat, and educate patients and if patients actively participate in their care and adopt healthy lifestyle behaviors. Higher rates of preventable hospitalizations may pinpoint areas in which improvements can be made in the quality of the health care system.
Preventable hospitalizations may also be viewed as an indicator of efficiency within the system, based on the understanding that spending on preventable hospitalizations is unnecessary and less cost effective than prevention.
Preventable hospitalizations may also be viewed as an indicator of efficiency within the system, based on the understanding that spending on preventable hospitalizations is unnecessary and less cost effective than prevention.
- Ex: Asthma
- Asthma is a condition that may result in preventable hospitalization because patients may be hospitalized if they do not receive adequate outpatient care or do not have access to appropriate medications. Asthma is also a condition that is directly influenced by environmental factors, such as air quality and housing conditions. Therefore, hospitalization may be avoided by increasing access to care and treatment and by improving air quality and housing conditions.
Delaware ranks seventeenth in the country for its rate of preventable hospitalizations.
(America’s Health Rankings)
(America’s Health Rankings)
GIS maps were developed by Delaware’s Division of Public Health (DPH) and its Office of State Planning Coordination (OSPC).
Poor performance of the health care system—including excessive and potentially unnecessary spending, inadequate access to care, and poor or uneven quality of care—have driven reform efforts for decades. The Affordable Care Act (ACA), passed in 2010, aims to reduce costs, increase access, and improve quality of care. Embedded in many provisions of the ACA are opportunities to address social determinants of health and reduce health inequities, particularly through investments in community health.
